Inequality in living standard among Tribal households of Odisha: A rural/urban comparison
| Abstract | Result and Analysis |
| Introduction | Conclusion |
| Statistical Tools used |
Abstract
This paper is a brief analysis on living standard of tribal people of Odisha in terms of household expenditure which includes the expenditure towards food,clothing,health and education etc.The study is based on the latest available NSS(National Sample Survey ) data of the year 2011-12.Taking monthly household expenditure as basic indicator the tribal households have been distributed over different economic classes like lowest ,middle and upper classes separately for rural and urban sector.Then the inequality among lowest and upper classes and within middle classes has been measured by the statistical measures “GINI-INDEX” and “LORENZ CURVE”.This paper also high-lights the rural urban disparity in standard of living of the tribal households of Odisha.
Introduction
As per the recent result of population census 2011, the Scheduled Tribe (ST) population of the State of Odisha is 9,59,0756, which constitutes 22.8 percent of the total population of the State. They are the most marginalized and poor social group in the State. But for measurement of poverty only a cut- off line is used to distribute the whole population in to two parts i.e. poor and non-poor .It does not measure the uniform changes over the entire community from top to bottom. In this paper an attempt has been made to measure disparities among tribal people in terms of their living standard in different economic classes based on the National Sample Survey data. The latest household survey on consumer expenditure had been conducted by NSSO, Govt of India during July 2011- June 2012. Another independent sample of equal size had been surveyed by the State Directorate of Economics and Statistics, Odisha using the same guidelines of NSSO. These two sets of sample data had been collected by these Government agencies from the sample households by sampling technique. For this study, the combined data of these two agencies on monthly household expenditure has been taken as the basic indicator for standard of living. Monthly expenditure includes item wise expenditure on food, clothing, education and health etc. The distribution of five economic classes of tribal households has been made over the monthly expenditure using pentile distribution of Statistics.
Statistical Tools used
The devices “LORENZ CURVE” and “GINI INDEX” have been used to measure the inequality in living standard of the tribal people of Odisha. A graphical representation of inequality distribution is called as Lorenz curve. On the graph, a straight diagonal line represents perfect equality of the expenditure distribution; the Lorenz curve lies below it represents inequality in distribution. The Gini Index measures the inequality among values of a frequency distribution (for example levels of expenditure). This lies between 0 to 1 ; “0” expresses perfect equality where all values are the same (for example, where everyone has an exactly equal expenditure) and “1” expresses maximal inequality among values (for example where only one household has all the expenditure).To construct the Gini Index, the cumulative percentage of Xi (distribution of population low to high) has been taken on the horizontal axis and the cumulative percentage of Yi (distribution of consumption expenditure) has been taken on the vertical axis. Then GINI INDEX OR GINI COEFFICIENT has been calculated using the following formula1.

For this study N= cumulative percentage total =100
Result and Analysis
A: Distribution of tribal households in different economic classes
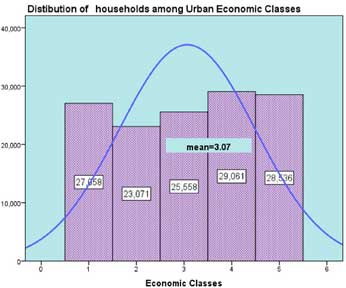
The following figures fig-1 and fig-2 show the normal distribution of tribal households in pentile economic classes for both rural and urban sectors of Odisha respectivily. From the normal curve of fig-1, it is obseved that maximum concerntration of tribal households of rural sector is in lower two classes.The concertration decreases towards upper classes. But the mean of the tribal living in rural Odisha lies within second and third economic classes.In the urban sector,however, as it is seen from fig-2 that the concerntration of tribal households are in the lowest and two higher economic classes where as it is comparatively less in second and third classes. as per the curve of normal distribution the mean of the tribal living in urban Odisha lies within third and fourth economic classes.
Fig-1
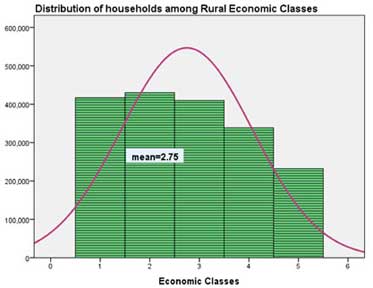
Fig-2
B: Distribution of tribal households by major source of living
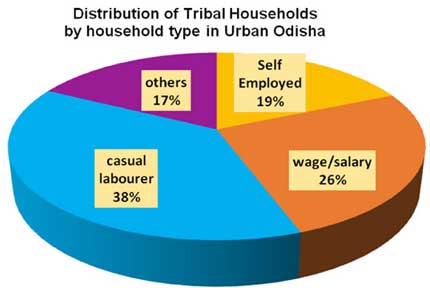
The following figures fig3 and fig4 show the percentage distribution of tribal households by household types for both rural and urban sectors of Odisha respectively.The household types are different for rural and urban sectors.The household types has been decided according to the major source of living of the households.From fig-3 it is obseved that in rural sector majority of the tribal households (65%) depends upon agriculture from which 39% are the households of cultivators , and 26% are households of agricultural labourers. .Again out of the rest 35% only 10% are own account workers’ or self employed in non-agriculture,5% are regular wage or salary earners’ and 4% are of other category like pensioners,rentiers or having no economic activities. For urban sector it is seen from fig-4 that 38% households are of casual labourers’, 26% are of regular wage ang salary earners,19% are of own account workers or self employed ones and 17% are of other category like pensioners,rentiers or having no economic activities
Fig-3
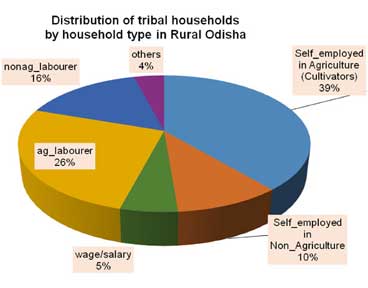
Fig-4
C: Inequality in living standard of tribal households in lower, middle and upper classes
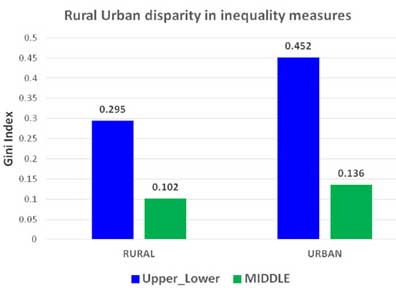
For this study the entire tribal households are distributed among five economic classes based on the monthly household expenditure. Then from the pentile classes lower class is the first pentile class which consists of lowest 20% households, upper class is the fifth class consists of highest 20% households and middle class is the combination of second, third and fourth classes which consists of middle 60% households. Fig-5 shows the inequality distribution of tribal households among lower and upper classes and within middle classes in rural sector of Odisha, it is observed that the inequality curve has very significant gap from the line of inequality whereas the gap is too less in middle class. Also the same conclusion can be drawn for urban sector in fig-6. But when the gap of lower-upper curve of rural and urban sector is observed it can be concluded that the gap is more in case of urban sector. For detail measure of inequality Gini-Index presented in fig-7, It can be stated that inequality among lower and upper classes is nearly two times more in urban sector than one observed in rural sector.
Fig-5
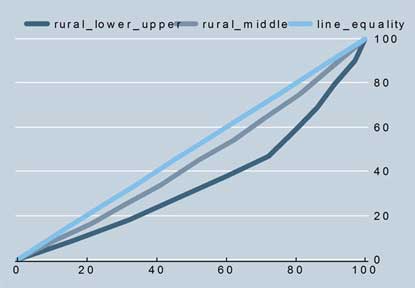
Fig-6

Fig-7
Conclusion
In this study some issues related to rural urban disparity in standard of living of tribal people of Odisha has been analysed. As per the study, in rural sector the order of concentration of tribal households is found to have declined from lower to upper classes i.e from poor to rich classes, where as in urban sector, the concentration is more in both poor and rich classes but less in middle classes. Using Lorenz curve and Gini Index as the measure of inequality it is also observed that the inequality is high in case of the urban sector than in the rural sector. But in middle class the inequality is much less in both rural and urban sector. Although many of the statistics relating to poverty indicate the success of poverty eradication programmes and development programmes for the tribal people of Odisha, yet disparities among classes and sector still exist significantly. This calls for further study to determine the reasons of disparities and, accordingly, formulation of policy so that inequality is reduced.
Notes
-
For definition and calculating formula of Gini Index the author relied on The free encyclopaedia http://en.wikipedia.org/wiki/Gini-coefficient


