Prevalence of Anemia among KutiaKondha of TumudibandhaBlock,Kandhamal District, Odisha
| Sanjeev Baliarsingh | |
| Sambit Kumar Mohapatra | |
| Dr. Kanhu Charan Satapathy |
| Abstract | Methodology |
| Introduction | Ethical clearance |
| Area and people | Discussion |
| Conclusion |
Abstract
In the present study a modest attempt has been made to study the anemia status of Kutia Kondha community of Belghar, in Tumudinadha block of Kandhamal district in the state of, Odisha. Blood sample of 370 individuals were collected and haemoglobin percentage was analysed to know the anemia status. It was observed that the mean haemoglobin percentage among the Kutia population is 8.16 which is very low as compared to other populations. Further the mean haemoglobin percentage among the Kutia males are found to be 8.29 as compared to 8.09 among the females. The present finding reveals high incidence of anaemia among the tribes in India and the condition is more critical among the Particularly Vulnerable Tribal Groups (PVTGs) such as Kutia Kondha which needs special medical attention.
Key words: Kutia Kondha, Haemoglobin and Anemia
Introduction
Anemia is usually defined as a decrease in the amount of red blood cells (RBCs) or haemoglobin in the blood (Lippincott and Wilkins, 2006). It can also be defined as a lowered ability of the blood to carry oxygen (Rodak, 2007). WHO defines anemia as a condition in which the Hemoglobin (Hb) content of blood is lower than normal as a result of deficiency of one or more essential nutrients, regardless of the cause of such deficiencies (WHO, 1989). It is low blood hemoglobin concentration, which is considered to be a public health problem in countries of any income group, be they are low-, middle high, and has significant adverse health consequences, as well as adverse impacts on social and economic development (Horton and Levin, 2001; Horton and Ross 2003; Stevens et.al, 2013; Alcazar, 2013). Anemia continues to be a major public health problem among females of reproductive age in developing country settings (Bentley and Griffiths, 2003). Globally, anemia affects 1.62 billion people, which corresponds to 24.8% of the population. The highest prevalence is in preschool-age children (47.4%), and the lowest prevalence is in men (12.7%). However, the population group with the greatest number of individuals affected is of pregnant women (41.8%) (WHO, 2008). In women, anemia may become the underlying cause of maternal mortality and perinatal mortality (Ezzati et.al, 2002). In 2011, the highest prevalence of anemia was in children, and the lowest prevalence was in non-pregnant women (WHO, 2011). About 74 percent of pregnant women in Bangladesh, 63 percent in Nepal, 58 percent in Sri Lanka and Myanmar, and 51 percent in Indonesia suffer from anemia (Capoor and Grade, 2000). WHO has estimated that prevalence of anemia in pregnant women is 14 per cent in developed countries, and 51 per cent in developing countries with 65-75 percent in India alone (DeMayer and Tegman, 1995).
Prevalence of anemia in all the groups is higher in India as compared to other developing countries (DeMayer and Tegman, 1995; Kalaivani, 2009). The problem becomes more severe as more women are affected with it as compared to men (Malhotra et al, 2004). It is estimated that about 20%-40% of maternal deaths in India are due to anemia and one in every two Indian women (56%) suffers from some form of anemia (NFHS-III, 2005-2006). Smaller-scale studies conducted in India of micronutrient deficiency confirm the high prevalence of anemia among adolescent girls and women (Kanani&Poojara, 2000; Chakma et al, 2000; Rajaratnam et al, 2000; Kapil et al, 1999). In the work done among the women of Andhra Pradesh, the prevalence of anemia was found to be high among all women, and the differences in anemia prevalence across the population are related to social class, urbanrural location, and nutrition status (Bentley and Griffiths, 2003). A cross sectional study conducted in Madhya Pradesh revealed severe anemia in 40% of Abhujmaria, 29% of Birhor and 42.2% of Baiga primitive tribes (RMRC, Jabalpur, 1984-95).
The majority of Bondo, Didayi, Kondha and Juanga primitive tribes of Orissa had different grades of anemia (as per WHO classification) as an important clinical manifestation (ICMR, 2003). Girls from Bargarh district had significantly lower mean Hb levels than those from the Jajpur and Khurda district of Odisha (Bulliya, 2007). It was furtherrevealed that prevalence of anemia was extremely high in non-school going adolescent girls (most were moderately anemic) and required more research and public health interventions (Bulliya et al, 2007). Another study reported 85% of PaudiBhuyan primitive tribes of Sundergarh district suffering from different grades of anemia (Bulliya et al, 1999-2000).
Area and people
The word ‘Kandha’is derived from the Telugu word Kondawhich means a small hill as well as the hill men. Originally they were hill dwellers. The Kutia Kondhas are one of the thirteen Particularly Vulnerable Tribal Groups (PVTG) of Odisha mainly found in Belghar-Lanjigarh highland of Kandhamal and Kalahandi districts. The present study deals with the Kutia Kondha community of Belghar of Tumudhibandha block in Kandhamal district. The settlements of Kutia Kondha villages are linear type. They are mainly shifting cultivators but depend on forest produce. They mainly grow turmeric and a variety of Cereals and pulses (kandula Dali). They organize themselves into strong clan groups. They speak in Kui dialect (Dravidian language) (Ota and Sahoo, 2010).
Methodology
The present study is based on the data collected through the field investigation carried out among the Kutia Kondha of Tumudibandha block, Kandhamal district, Odisha. Besides, it also relies on the secondary sources. Primary data was collected using anthropological fieldwork techniques like scheduled questionnaire, interviews, case studies and focus group discussions. The period of field investigation spanned from 7th October 2015 to30 th November 2015.Primary outcome variables in the analysis were created from hemoglobin measurements. The males and females were classified as normal, moderately, or severely anemic, based upon their hemoglobin status, following the prescribed World Health Organization (WHO) classification. According to this classification,the severe anemia condition for both male and female occurs whenhemoglobin concentration falls below 7 g/dl; moderate anemia conditionoccurs when the concentration lies between 7-11.9 g/dl for male and between 7-9.9 g/dl for female; the normal haemoglobin being 10-12 g/dl for female and 12-14 g/dl for male.Haemoglobin level measured through Sahli’sHaemometer and was analyzed using SPSS 20.0 and MS-Excel and was compared with secondary data. Data was collected from the study population by house-to-house visits using a pre-designed semi-structured questionnaire after taking verbal consent.
Ethical clearance
This research was carried out in conformity with the ICMR’s ‘Ethical Guidelines of Biomedical Research on Human Participants (2006)’ and ethical clearance was taken at the Department level from the appropriate authorities. Subjects who were voluntarily participating were only concerned.(ICMR,2006) Results:
Table 1: Age group wise distribution of Hemoglobin Percentage among the Kutia Kondha
| Age Group | Male (Mean) | Female (Mean) | Total (Mean) | Std. Deviation |
| 0-10yrs | 8.60 | 8.13 | 8.35 | 1.447 |
| 11-20yrs | 7.32 | 7.77 | 7.60 | 1.409 |
| 21-30yrs | 9.00 | 8.50 | 8.70 | 1.660 |
| 31-40yrs | 8.78 | 8.71 | 8.72 | 1.944 |
| 41-50yrs | 8.79 | 7.95 | 8.37 | 1.792 |
| 51-60yrs | 9.27 | 7.90 | 8.72 | 1.542 |
| 61 & above | 8.35 | 8.00 | 8.21 | 1.292 |
| Total | 8.29 | 8.07 | 8.16 | 1.600 |
From table no. 1 it is revealed that the mean hemoglobin percentage of Kutia Kondha is 8.16, whereas for males it is 8.29 and for females it is 8.07. The mean hemoglobin percentage in the 0-10 years of age group is higher in male (8.60) than the female (8.13%); in 11-20 years is higher in females (7.77%) than in males (7.32%); in 21-30 year of age group it is higher among the males (9.00%) than the females (8.50%); in the 31-40 age group it is higher in males (8.78%) than in females (8.71%); in 41-50 it is higher in males (8.79%) than in females (7.95%); in 51-60 years age group it is higher in males (9.27%) than in females (7.90%) and in 61 and above it is higher in males (8.35%) than in females (8.00%). So over all it is seen that mean hemoglobin percentage is low among the Kutia Kondhas however, males having a higher value than the females.
Table 2: HemoglobinPercent and status of Anemia of Kutia Kondha
| Age Group | Anemia | Total | |||
| Normal | Moderate | Severe | |||
| 0-10yrs | 4 (12.90) | 61 (23.37) | 9 (11.53) | 74 | |
| 11-20yrs | 8 (25.80) | 82 (31.41) | 44 (56.41) | 134 | |
| 21-30yrs | 5 (16.12) | 20 (7.66) | 2 (2.56) | 27 | |
| 31-40yrs | 7 (22.58) | 31 (11.87) | 5 (6.42) | 43 | |
| 41-50yrs | 4 (12.90) | 26 (9.96) | 8 (10.25) | 38 | |
| 51-60yrs | 1 (3.22) | 20 (7.66) | 4 (5.13) | 25 | |
| 61 & above | 2 (6.45) | 21 (8.04) | 6 (7.70) | 29 | |
| Total | 31 | 261 | 78 | 370 | |
F-5.225, df-6, p=.000
Table no 2 and Figure 1 shows the Hemoglobin Percentage of the studied Kutia Kondha population according to age groups where it shows, out of 370 population,11-20yrs age groups are showing highest percentage of moderate (31.41%) and severe (56.41%) anemia than other age group while 0-10yrs age groups are showing moderate (23.37%) and severe (11.53%) anemic condition next to 11-20yrs age groups,21-30yrs age groups shows 7.66 % of moderate and 2.56 % of severe anemia, 31-40yrs age groups shows11.87 % moderateand 6.42% of severe anemia, 41-50yrs age groups shows 9.96% of moderate and 10.25 % of severe anemia, 51-60yrs age group shows 7.66% of moderate and 5.13% of severe anemia while 61 & above age group shows 8.04 % of moderate and 7.70% of severe anemia. Normal haemoglobin percentage was recorded as12.90% in 0-10yrs, 25.80% in 11-20yrs age groups which shows highest normal percentage than other age group, 22.58% in 31-40yrs age groups, 16.12% in 21-30yrs age groups, and 6.45% in 41-50yrs age groups. The differences observed between age groups are found significant and most of them falls in the category of moderate to severe anemia category.
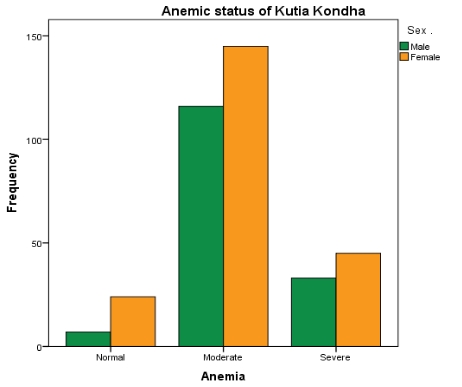
Figure 1: Distribution of Kutia Kondhas in relation to the level of Anemia status.
Table 3: Sex-wise distribution of haemoglobin percentage and status of anemia among the Kutia Kondha
|
Anemic |
Sex |
Total |
Percent |
Mean |
Std. Dev. |
|||
|
Male (Percent) |
% |
Female (Percent) |
% |
|||||
|
Normal |
7 (4.48) |
1.89 |
24 (11.21) |
6.48 |
31 |
8.37 |
11.48 |
1.262 |
|
Moderate |
116 (74.35) |
31.35 |
145 (67.75) |
39.18 |
261 |
70.54 |
8.33 |
0.992 |
|
Severe |
33 (21.15) |
8.91 |
45 (21.02) |
12.16 |
78 |
21.09 |
6.29 |
0.512 |
|
Total |
156 (42.16) |
42.16 |
214 (57.87) |
57.84 |
370 |
100 |
8.16 |
1.600 |
Table no 3 shows the anemic status of the Kutia Kondha population according to sex, which shows that out of 370 populations,males and females are constitute 42.16 % 57.87% respectively . Out of them 21.09 % are in severe anemic condition, 70.54 % are in moderate anemic condition while only 8.37 % are shows normal haemoglobin concentration. From the total population males and females are showing 1.89% and 6.48% in normal condition, 31.35% and 39.18% are suffering from moderate anemia and 8.91% and 12.16% are suffering from severe anemia respectively. Out of total male, 116 (74.35%) are in moderate anemic, 33 (21.15%) are in severe anemic and only 7(4.48%) are in normal condition and in females, 145 (67.75%) are moderate, 45 (21.02%) are severe and 24 (11.21%) are in normal condition.
Figure no 1 HemoglobinPercent of Kutia Kondha
Table 4: shows the anemic status of different population in India and world.
|
Population |
Percentage suffering from Anemia (%) |
Author |
|
World (Pregnant,15-49yrs) |
29 |
World Health Organisation, 2011 |
|
World ( Non pregnant women, 15-49 yrs) |
38 |
World Health Organisation, 2011 |
|
India (pregnant women) |
87 |
Capoor and Gade 2000 |
|
Haryana (married women) |
69.7 |
NFHS-III 2005-2006 |
|
Assam(married women) |
72 |
NFHS-III 2005-2006 |
|
Jharkhand(married women) |
68.4 |
NFHS-III 2005-2006 |
|
India (children,6-59months) |
69.5 |
Prakash V Kotecha,2011 |
|
Delhi(children,6-59months) |
57.0 |
Prakash V Kotecha,2011 |
|
Madhya Pradesh (children,6-59months) |
74.1 |
Prakash V Kotecha,2011 |
|
Chhattisgarh (children,6-59months) |
71.2 |
Prakash V Kotecha,2011 |
|
Bihar (children,6-59months) |
78 |
Prakash V Kotecha,2011 |
|
Jharkhand (children,6-59months) |
70.3 |
Prakash V Kotecha,2011 |
|
West Bengal (children,6-59months) |
61.0 |
Prakash V Kotecha,2011 |
|
Andhra Pradesh (children,6-59months) |
70.8 |
Prakash V Kotecha,2011 |
|
Mizoram (children,6-59months) |
44.2 |
Prakash V Kotecha,2011 |
|
Nalgonda,Telangana (above 50years) |
29.86 |
VarunMalhotra et.al, 2015 |
|
Kerala (Pallakad district tribal women,15-49yrs) |
78.32 |
Sreelakshmi et.al,2012 |
|
Odisha (children,6-59months) |
65.0 |
Prakash V Kotecha,2011 |
|
Odisha (PaudiBhuyan) |
85 |
Bulliya et al. 1999-2000 |
|
Odisha (Kutia Kondha) |
91.63 |
Present Study, 2015 |
Discussion
Anaemia is the most prevalent nutritional deficiency disorder in the world. There are many studies showing women especially pregnant women, children are anemic (Bentley and Griffiths, 2003; Bulliya, 2007; Capoor and Gade, 2000; Kapil, 1999, etc.). It affects all age groups but the most vulnerable are pre-school age children, women and tribal populations. According to WHO if the prevalence of anemia at community levels is more than 40%, it is considered as problem of high magnitude (Seshadri, 1999). Present study shows alarmingly high incidence of 70.54% of moderate anemia; 21.09 % are suffering from severe anemia and only 8.37 % shows normal haemoglobin concentration. The prevalence is high among the adolescents. Most of the females (39.18%) are in moderate anemic condition than males (31.35%); females (12.16%) are suffering from higher to severe anemic condition than males (8.91%) and also females (6.48%) show more percentage of normal condition than males (1.89%). It is observed that in the working age group both male and females hemoglobin concentration is more in compare to child, adolescents and old age group.
Conclusion
In conclusion the high prevalence of severe and moderate anemia is seen in most of the children and adolescent age group of the Kutia Kondhas. More percentage of the women are having severe anemia as compared to their male counterparts. But the more percentage of males are having moderate anemia as compared to the women. Therefore, the present study emphasiseson special attention towardsthis population from medical care point of view. It however needs further research to explore the strategies for the community of Kutia Kondhs to cope with the malady.
Reference
-
Alcazar L. 2013.The economic impact of anemia in Peru.Lima: Group for the analysis of development and action against hunger.
-
Bentley M.E. and Griffiths P.L. 2003.The Burden of anemia among women in India.European Journal of Clinical Nutrition; 57: 52-60.
-
Bulliya G., Mohapatra S.S.S., Kerketta A.S. and Nayak R.N. 1999-2000. Assessment of Health and nutritional profile among elderly population of Orissa primitive tribes. Annual Report, regional medical Research Centre, Bhubaneswar: p.40
-
Bulliyya G., Mallick G., Sethy G. S. and Kar S.K. 2007.Hemoglobin status of non-school going adolescent girls in three districts of Odisha, India. Int J Adolesc Med health; 19(4):395-406.
-
Capoor I. and Gade J. 2000. CHETNA Team, Paper presented at the World Congress on Women’s Health on Novemer 10th, 11th and 12 th, 2000 at Science city, Calcutta.
-
Chakma T., Rao P.V. and Tiwary R.S. 2000.Prevalence of anemia and worm infestation in tribal areas of Madhya Pradesh.J Indian Med Assoc; 98: 561-567.
-
DeMayar E.M. and Tegman A. 1995.World Health Statistics Quarterly; 38:302-316.
-
Ezzati M., Lopus A.D., Dogers A., Vander H.S. and Murray C. Lancet; 2002.Selected major risk factors and global and regional burden of disease.360: 1347-60.
-
Horton S. and Levin C. 2001.Commentary on “evidence that iron deficiency anemia causes reduced work capacity”.J Nutr; 131: 691S-696S.
-
Horton S. and Ross J. 2003.The economics of iron deficiency.Food Policy; 28: 51-75.
-
ICMR. 2003. Health status of Primitive Tribes of Orissa. RMRC, Bhubaneswar, ICMR Bulletini; 33(10)
-
Indian Council of Medical Research, 2006.Ethical Guidelines for Biomedical Research on Human Participants, ICMR, New Delhi.
-
Kalaivani K. 2009. IJMR; 130: 627-633.
-
Kanani S.J. and Poojara R.H. 2000. Supplementation with iron and folic acid enhances growth in adolescent Indian girls. J Nutr; 130:452S-455S.
-
Kapil U., Pathak P., Tandon M., Singh C., Pradharib R. and Dwivedi S.N. 1999. Micronutrient deficiency disorders amongst pregnant women in three urban slum communities of Delhi. Indian Pediat; 36:983-989.
-
KotechaPrakash V. January 2011. Nutritionalanemia in young children with focus on Asia and India.Indian Journal of Community Medicine/Vol 36/Issue 1.
-
Lippincott Williams & Wilkins. 2006.Stedman's medical dictionary (28th ed.). Philadelphia: p. Anemia.ISBN 9780781733908
-
Malhotra V, et.al. 2015. An Epidemiological study on prevalence of anemia among elderly population residing in rural Nalgonda, Telengana, India. Scholars Journal of Applied Medical Sciences
-
Malhotra P., Kumara S., Kumar R. and Varma S. 2004.JAPI; 52:18-20.
-
National consultation on control of nutritional anemia in India.Department of family Welfare (maternal Health Division), ministry of Health and Family Welfare, NirmanBhawan, New Delhi, 1998.
-
National Family Health Survey (NFHS-III).IIPS, Mumbai 2005-2006.
-
Ota A.B, Sahoo A.C, 2010, Kutia Kandha, Scheduled Caste & Scheduled Tribes Research and Training Institute (SCSTRTI), Bhubaneswar.
-
RMRC for Tribal, Progress of Research Activities.1984-95., Jabalpur: p.3.
-
Rajaratnam J., Abel R., Asokan J.S. and Jonathan P. 2000.Prevalence of anemia among adolescent girls of rural Tamil Nadu.Indian Pediat; 27: 532-536.
-
Rodak, Bernadette F. (2007). Hematology : clinical principles and applications (3rd ed.). Philadelphia: Saunders. p. 220.ISBN 9781416030065
-
Seshadri S.1999. Department of foods and nutrition. WHO collaborating centre for Nutrition Research. The Maharaja Sayajirao University of Baroda, Vadodara, India.
-
P R Sreelakshmi,et.al.2012.Anemia and Body Mass Index of non pregnant tribal women of reproductive age group in Palakkada district of Kerala, Indian J.Prev. Soc. Med Vol 43.1.
-
Stevens G.A., Finucane M.M., De-Regll L.M., Paclorek C.J., Flaxman S.R., Branca F. et al. 2013. Global, regional and national trends in haemoglobin concentration and prevalence of total and severe anaemia in children and pregnant and non-pregnant women for 1995-2011: a systematic analysis of population representative data. Lancet Glob Health; 1:E16-E25.
-
WHO. 2015. The Global Prevalence of Anaemia in 2011. Geneva. Switzerland.
-
WHO. 2008. Worldwide prevalence of Anaemia 1993-2005: WHO Global database of anaemia. CDC.
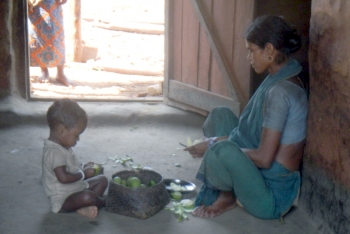
Figure 2: Kutia Kondha mother with her baby preparing raw mangos.
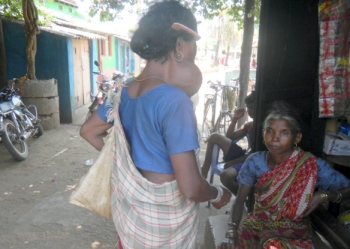
Figure 3: A Kutia Kondha women in the Belghar daily market.
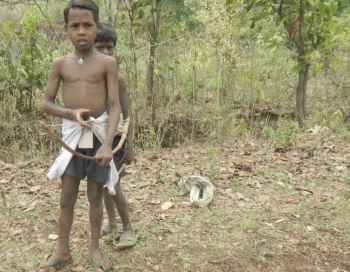
Figure 4: Kutia Kondha boys hunting small birds and animals.
- Sanjeev Baliarsingh, Lecturer and Head (I/C), Department of Anthropology, Govt. Autonomous College, Phulbani
- Sambit Kumar Mohapatra, Research Scholar, Dept. of Anthropology, Utkal University, Bhubaneswar, Odisha
- Dr. K. C. Satapathy, Reader, Dept. of Anthropology, Utkal University, Bhubaneswar, Odisha


