Epidemiology of blood pressure among some tribes of India:Bhumij, Bathudi and Savar
| Shyama Mohapatra | |
| Dr. Kanhu Charan Satapathy | |
| P. K. Patra | |
| Dr. P. K. Das |
| Abstract | Blood pressure |
| Introduction | Discussion |
| Materials and Method | Salt intake |
| Ethical approval | Conclusion |
Abstract
The present study was conducted in the Balidiha Grama Panchayat of Samakhunta Block of Mayurbhanj district. It involves 119 individuals, 147 individuals and 91 individuals of Bhumij, Bathudi and Savar communities respectively, aged above 20 years. The main objective was to study and compare the systolic blood pressure, diastolic blood pressure, heart rate, pulse rate amongst three tribes (i.e., Bhumij, Bathudi and Savar) living in the same ecological habitat of Mayurbhanj district, to study the variation in the hypertension among the three tribes, to study the association of the blood pressure with the socio-economic and demographic factors. A study instrument, which included schedule and questionnaire for nutritional status and physical measurements of blood pressure, heart rate and pulse rate, height and weight, was used to collect data. Mean standard deviation, ANNOVA and correlation coefficient was used to analyze the data. It was observed that age as well as the salt intake has a significant effect on blood pressure. The overall prevalence of hypertension was found to be 21.01%, 12.59% and 9.26% among Bhumij, Bathudi and Savar respectively. It is higher among the females (10.92% in Bhumij and 8.15% in Bathudi) than males (10.08% in Bhumij and 4.44% in Bathudi). But in case of Savar the more percentage of males (6.10%) are affected with high blood pressure than the females (3.66%). The prevalence of high blood pressure is seen to be quite high and is associated with socio-economic and demographic factors.
Keywords: Epidemiology, Systolic Blood Pressure, Diastolic Blood Pressure, Heart Rate, Pulse Rate, Mean Arterial Pressure (MAP), BMI.
Introduction
The core idea of Epidemiology though almost 2400 years, when Hippocrates expressed the idea that environmental factors influence the occurrence of diseases, this term appeared for the first time in the year 1802 by Spanish physician Villalba in Epidemiología Española. Epidemology over the years has grown, as a branch of medical science, beyond simply describing the epidemic diseases to cover the description of ‘non-disease health-related conditions, such as high blood pressure and obesity. Over the last several decades, numerous studies have reported the influence of a variety of biological, behavioral, psychosocial and socio-cultural factors on the blood pressure levels of many human population groups inhabiting diverse ecological settings. Particularly the study of high blood pressure or hypertension as a health disorder of serious concern amongst different communities has, in recent years, attracted many researchers. Of different communities, the tribal communities have been of particular interest as their living, lifestyle and cultural practices are so different from the non-tribals. In India, studies have begun to ascertain the extent of the prevalence of high blood pressure or hypertension amongst different tribes. Some tribes like the Jenu Kurba tribe of Mysore (Hathur et al 2013), the Nomad tribes of Rajsthan (Sachdev, 2011) and Nicobarese tribal population of Car Nicobar Island (Manimunda et al 2011) have been studied. The common conclusion is that hypertension is on rise amongst the tribes. This paper augments the studies above by considering three more tribes, namely Bhumij, Bathudi and Savar, who belong to the Mayurbhanj district of Odisha, a province situated in the eastern coast of India
Materials and Method
The present study was carried in four hamlets namely Bhumij dominated Bhunda Sahi and Dunguri Sahi, Bathudi dominated Danamara and Savar dominated Dehuri Sahi (vide Table-1 and Table-2). These four hamlets fall under Balidiha Gram Panchayat of Samakhunta Block of Mayurbhanj district.


Fig 1 Map of study area Shamakhunta Block, Mayurbhanj, and Odisha (Source: http://oddistricts.nic.in/district_profile/dist_map.php)
Table 1 The household census of all three tribes
|
Tribes |
Male |
Female |
Total |
|
Bhumij |
120 |
127 |
247 |
|
Bathudi |
186 |
200 |
386 |
|
Savar |
118 |
130 |
248 |
Table 2 Participation in blood pressure measurement
|
Tribes |
Male |
Female |
Total |
|
Bhumij |
65 |
54 |
119 |
|
Bathudi |
66 |
81 |
147 |
|
Savar |
46 |
45 |
91 |
|
Total |
177 |
180 |
357 |
Data was collected from the study population by house-to-house visits using a pre-designed semi-structured questionnaire after taking verbal consent. The questionnaire included socio-demographic and personal characteristics like age, sex, level of education, per capita income, occupation, food consumption pattern. The assessment of nutritional status has been done with the help of BMI. Height was measured with the help of a Harpenden anthropometer rod and weight was measured using a portable weighing machine.
Ethical approval
The present study had the prior approval of the Departmental Ethics Committee. The consent of families and clearance from village heads were taken and the purpose of visit was also explained. The subjects who participated voluntarily were only considered.
Blood pressure
For assessment of the individual with hypertension or borderline hypertension, heart rate mercury sphygmomanometer and stethoscope was used and the recommendation of the JNC-VII (2003) was adopted for hypertension classification which is shown in Table 3.
Table 3. JNC-VII for hypertension classification
|
Category |
SBP* |
DBP* |
|
Normal |
<120 |
And <80 |
|
Pre-hypertension |
120-139 |
Or 80-89 |
|
Stage 1 Hypertension |
140-159 |
Or 90-99 |
|
Stage 2 Hypertension |
≥160 |
Or≥100 |
*SBP= Systolic blood pressure; DBP= Diastolic blood pressure
Results:
Table 4. Socio- demographic characteristics of study population
|
Characteristics |
Number |
Percentage |
|
Income |
||
|
Bhumij |
||
|
Low income group |
40 |
65.57 |
|
Middle income group |
8 |
13.12 |
|
High income group |
13 |
21.31 |
|
Bathudi |
||
|
Low income group |
21 |
50 |
|
Middle income group |
12 |
28.57 |
|
High income group |
9 |
21.43 |
|
Savar |
||
|
Low income group |
15 |
21.43 |
|
Middle income group |
16 |
22.86 |
|
High income group |
39 |
55.71 |
|
Occupation |
||
|
Bhumij |
||
|
Sedentary |
55 |
37.67 |
|
Moderate |
91 |
62.33 |
|
Bathudi |
||
|
Sedentary |
57 |
24.89 |
|
Moderate |
172 |
75.11 |
|
Savar |
||
|
Sedentary |
70 |
46.67 |
|
Moderate |
80 |
53.33 |
Table 4 shows that most of the people come under the low income group in Bhumij (65.57%) and Bathudi (50%), but in Savar maximum comes under the high-income group (55.71%). The occupational status of the three tribal groups is classified in two categories i.e. sedentary & moderate of both the sexes from the age group20 to 60 years. Teacher, tailor, barber, shoe maker, priest, retired person, land lord, peon, postman, house wife, nurse, etc. are all put under the category of sedentary occupations, whereas under moderate occupations comes fisher man, basket maker, potter, gold smith, agricultural labor, carpenter, mason, rickshaw puller, electrician, fitter turner, welder, industrial labor, cooli, weaver, drivers, servant, maid are put. It is thus observed that in all these three tribes a higher percentage of their members are engaged in the moderate occupations. But of all these tribes while the percentage of population engaged in sedentary occupations is the highest in Savar tribe (46.67%), it is the lowest in Bathudi tribe (24.89%). As per the occupational status of the three tribal groups is concerned it is statistically significant at P<0.05. The results of the measurements of mean systolic blood pressure, mean diastolic blood pressure, mean heart rate, mean pulse rate are given respectively in Tables 5, 6, 7 and 8. The blood pressure distribution across different age groups amongst these three tribes is displayed in Table 9, where as their MAP (Mean Arterial Pressure) status, Nutritional status and salt intake per person are presented in Tables 10, 11 and 12 respectively.
Table 5 Mean of systolic blood pressure of Bhumij, Bathudi and Savar community
|
BHUMIJ |
BATHUDI |
SAVAR |
||||||||
|
AGE GROUP |
SEX |
N |
Mean |
Std. Deviation |
N |
Mean |
Std. Deviation |
N |
Mean |
Std. Deviation |
|
20-29 |
M |
17 |
124.41 |
25.671 |
22 |
120.23 |
20.844 |
18 |
109.44 |
11.362 |
|
F |
10 |
120.00 |
11.547 |
34 |
111.62 |
11.724 |
21 |
112.38 |
15.542 |
|
|
30-39 |
M |
20 |
126.00 |
14.564 |
8 |
125.63 |
13.999 |
11 |
118.64 |
15.345 |
|
F |
11 |
125.91 |
20.226 |
16 |
114.88 |
14.175 |
15 |
118.00 |
21.280 |
|
|
40-49 |
M |
9 |
125.56 |
16.287 |
9 |
132.00 |
15.158 |
8 |
120.63 |
33.428 |
|
F |
15 |
127.87 |
19.265 |
14 |
120.14 |
14.920 |
3 |
130.00 |
26.458 |
|
|
50-59 |
M |
8 |
125.63 |
14.985 |
13 |
141.92 |
28.834 |
3 |
110.00 |
18.028 |
|
F |
4 |
130.00 |
8.165 |
7 |
119.29 |
12.392 |
4 |
135.00 |
31.091 |
|
|
60+ |
M |
11 |
152.27 |
35.168 |
14 |
143.21 |
23.502 |
6 |
115.83 |
18.280 |
|
F |
14 |
148.79 |
22.358 |
10 |
150.00 |
22.608 |
2 |
155.00 |
63.640 |
|
|
Total |
M |
65 |
129.92 |
24.133 |
66 |
131.64 |
23.500 |
46 |
114.46 |
18.685 |
|
F |
54 |
131.59 |
20.941 |
81 |
119.14 |
18.614 |
45 |
119.33 |
23.563 |
|
|
Total |
119 |
130.68 |
22.661 |
147 |
124.75 |
21.786 |
91 |
116.87 |
21.261 |
|
F= 10.46, df= 2, p<0.05
Table 6. Mean of diastolic blood pressure of Bhumij, Bathudi and Savar community
|
BHUMIJ |
BATHUDI |
SAVAR |
||||||||
|
AGE GROUP |
SEX |
N |
Mean |
Std. Deviation |
N |
Mean |
Std. Deviation |
N |
Mean |
Std. Deviation |
|
20-29 |
M |
17 |
82.94 |
18.713 |
22 |
79.32 |
13.740 |
18 |
72.78 |
10.463 |
|
F |
10 |
80.00 |
12.247 |
34 |
73.44 |
10.584 |
21 |
73.57 |
10.505 |
|
|
30-39 |
M |
20 |
86.15 |
9.631 |
8 |
81.50 |
10.323 |
11 |
83.91 |
9.544 |
|
F |
11 |
80.91 |
13.382 |
16 |
75.63 |
10.308 |
15 |
76.33 |
10.601 |
|
|
40-49 |
M |
9 |
76.67 |
15.411 |
9 |
87.56 |
12.043 |
8 |
76.25 |
12.174 |
|
F |
15 |
85.27 |
13.874 |
14 |
79.29 |
11.579 |
3 |
83.33 |
23.094 |
|
|
50-59 |
M |
8 |
72.50 |
8.864 |
13 |
85.77 |
14.555 |
3 |
75.00 |
15.000 |
|
F |
4 |
86.25 |
11.087 |
7 |
77.14 |
10.351 |
4 |
86.25 |
9.465 |
|
|
60+ |
M |
11 |
86.82 |
20.158 |
14 |
74.29 |
11.242 |
6 |
77.50 |
12.145 |
|
F |
14 |
82.14 |
11.720 |
10 |
84.50 |
11.891 |
2 |
75.00 |
21.213 |
|
|
Total |
M |
65 |
82.43 |
15.542 |
66 |
80.91 |
13.263 |
46 |
76.80 |
11.411 |
|
F |
54 |
82.67 |
12.478 |
81 |
76.57 |
11.197 |
45 |
76.33 |
11.937 |
|
|
Total |
119 |
82.54 |
14.176 |
147 |
78.52 |
12.317 |
91 |
76.57 |
11.611 |
|
F=5.960, df= 2, p<0.05
Table 7. Mean of heart rate of Bhumij, Bathudi, Savar community
|
BHUMIJ |
BATHUDI |
SAVAR |
||||||||
|
AGE GROUP |
SEX |
N |
Mean |
Std. Deviation |
N |
Mean |
Std. Deviation |
N |
Mean |
Std. Deviation |
|
20-29 |
M |
17 |
73.41 |
6.315 |
22 |
72.91 |
8.394 |
18 |
72.44 |
9.593 |
|
F |
10 |
65.60 |
5.060 |
34 |
78.53 |
9.346 |
21 |
84.57 |
13.208 |
|
|
30-39 |
M |
20 |
76.10 |
7.181 |
8 |
77.00 |
12.421 |
11 |
74.00 |
13.849 |
|
F |
11 |
72.73 |
6.650 |
16 |
81.12 |
9.237 |
15 |
75.27 |
9.215 |
|
|
40-49 |
M |
9 |
78.00 |
9.592 |
9 |
77.44 |
9.812 |
8 |
72.13 |
4.357 |
|
F |
15 |
71.60 |
6.243 |
14 |
76.93 |
11.964 |
3 |
70.00 |
7.211 |
|
|
50-59 |
M |
8 |
73.00 |
7.010 |
13 |
76.46 |
10.063 |
3 |
69.33 |
8.327 |
|
F |
4 |
65.00 |
5.033 |
7 |
74.29 |
8.281 |
4 |
83.00 |
3.830 |
|
|
60+ |
M |
11 |
73.45 |
9.342 |
14 |
76.93 |
11.035 |
6 |
77.00 |
12.884 |
|
F |
14 |
69.43 |
6.198 |
10 |
80.80 |
11.933 |
2 |
76.50 |
12.021 |
|
|
Total |
M |
65 |
74.83 |
7.680 |
66 |
75.58 |
9.898 |
46 |
73.15 |
10.265 |
|
F |
54 |
69.67 |
6.452 |
81 |
78.68 |
10.022 |
45 |
80.00 |
11.780 |
|
|
Total |
119 |
72.49 |
7.573 |
147 |
77.29 |
10.053 |
91 |
76.54 |
11.506 |
|
F= 8.165, df= 2, p<0.05
Table 8. Mean of pulse rate of Bhumij, Bathudi, Savar community
|
BHUMIJ |
BATHUDI |
SAVAR |
||||||||
|
AGE GROUP |
SEX |
N |
Mean |
Std. Deviation |
N |
Mean |
Std. Deviation |
N |
Mean |
Std. Deviation |
|
20-29 |
M |
17 |
71.76 |
6.078 |
22 |
71.68 |
8.459 |
18 |
71.33 |
8.289 |
|
F |
10 |
64.40 |
4.402 |
34 |
76.24 |
8.015 |
21 |
83.24 |
13.003 |
|
|
30-39 |
M |
20 |
74.80 |
6.502 |
8 |
76.00 |
11.314 |
11 |
72.82 |
13.761 |
|
F |
11 |
72.00 |
6.450 |
16 |
79.81 |
8.581 |
15 |
73.40 |
9.560 |
|
|
40-49 |
M |
9 |
75.33 |
9.434 |
9 |
76.00 |
8.888 |
8 |
70.50 |
5.099 |
|
F |
15 |
69.60 |
5.616 |
14 |
74.93 |
10.630 |
3 |
68.67 |
7.572 |
|
|
50-59 |
M |
8 |
71.50 |
5.831 |
13 |
74.54 |
9.153 |
3 |
69.33 |
8.327 |
|
F |
4 |
65.00 |
5.033 |
7 |
73.14 |
6.817 |
4 |
81.00 |
2.000 |
|
|
60+ |
M |
11 |
71.82 |
8.122 |
14 |
76.07 |
11.296 |
6 |
76.33 |
11.483 |
|
F |
14 |
67.57 |
6.477 |
10 |
80.00 |
10.873 |
2 |
72.50 |
17.678 |
|
|
Total |
M |
65 |
73.17 |
7.044 |
66 |
74.29 |
9.559 |
46 |
72.07 |
9.671 |
|
F |
54 |
68.26 |
6.192 |
81 |
76.91 |
8.970 |
45 |
78.31 |
12.011 |
|
|
Total |
119 |
70.94 |
7.082 |
147 |
75.73 |
9.300 |
91 |
75.15 |
11.276 |
|
F=9.412, df= 2, p<0.05
From table 7 it is seen that the mean heart rate of male in Bhumij community is 74.83, Bathudi community is 75.58 and Savar community is 73.15. The mean heart rate of female in Bhumij community is 69.67, Bathudi community is 78.68 and Savar community is 80.00. The result is significant. Table 8 and figure 4 shows that the mean pulse rate of male in Bhumij community is 73.17, Bathudi community is 74.29 and Savar community is 72.07. The mean pulse rate of female in Bhumij community is 68.26, Bathudi community is 76.91 and Savar community is 78.31. The result is significant.
Table 9. Blood pressure distribution among Bhumij and Bathudi community
|
BHUMIJ |
||||
|
AGE GROUP |
SEX |
NORMAL BLOOD PRESSURE N (%) |
HYPOTENSION N (%) |
HYPERTENSION N (%) |
|
20-29 |
F |
5(4.20) |
2(1.68) |
3(2.52) |
|
M |
15(12.60) |
1(0.84) |
1(0.84) |
|
|
30-39 |
F |
8(6.72) |
0(0) |
3(2.52) |
|
M |
15(12.60) |
2(1.68) |
3(2.52) |
|
|
40-49 |
F |
13(10.92) |
1(0.84) |
1(0.84) |
|
M |
5(4.20) |
0(0) |
4(3.36) |
|
|
50-59 |
F |
3(2.52) |
1(0.84) |
0(0.00) |
|
M |
7(5.88) |
0(0) |
1(0.84) |
|
|
60+ |
F |
7(5.88) |
2(1.68) |
5(4.20) |
|
M |
7(5.88) |
0(0) |
4(3.36) |
|
|
TOTAL |
M |
49(41.18) |
6(5.04) |
12(10.08) |
|
F |
36(30.25) |
3(2.52) |
13(10.92) |
|
|
Total |
85(71.42) |
9(7.56) |
25(21.01) |
|
|
BATHUDI |
||||
|
AGE GROUP |
SEX |
NORMAL BLOOD PRESSURE N (%) |
HYPOTENSION N (%) |
HYPERTENSION N (%) |
|
20-29 |
F |
29(19.73) |
5(3.70) |
0(0.00) |
|
M |
18(12.25) |
2(1.48) |
2(1.48) |
|
|
30-39 |
F |
14(9.52) |
2(1.48) |
0(0.00) |
|
M |
7(4.76) |
0(0.00) |
1(0.74) |
|
|
40-49 |
F |
13(8.84) |
0(0.00) |
1(0.74) |
|
M |
7(4.76) |
0(0.00) |
2(1.48) |
|
|
50-59 |
F |
5(3.40) |
1(0.74) |
1(0.74) |
|
M |
8(5.44) |
0(0.00) |
5(3.70) |
|
|
60+ |
F |
5(3.40) |
1(0.74) |
4(2.96) |
|
M |
10(6.80) |
3(2.22) |
1(0.74) |
|
|
TOTAL |
M |
48(32.65) |
9(6.67) |
6(4.44) |
|
F |
68(46.26) |
5(3.70) |
11(8.15) |
|
|
TOTAL |
116(78.91) |
14(10.37) |
17(12.59) |
|
|
SAVAR |
||||
|
AGE GROUP |
SEX |
NORMAL BLOOD PRESSURE N (%) |
HYPOTENSION N (%) |
HYPERTENSION N (%) |
|
20-29 |
M |
16(17.58) |
1(19.33) |
1(1.22) |
|
F |
19(20.88) |
2(13.38) |
0(0.00) |
|
|
30-39 |
M |
9(9.89) |
1(16.36) |
1(1.22) |
|
F |
3(3.66) |
12(13.19) |
0(0.00) |
|
|
40-49 |
M |
2(2.44) |
5(5.50) |
1(1.22) |
|
F |
0(0.00) |
1(11.90) |
2(2.44) |
|
|
50-59 |
M |
3(3.30) |
0(4.46) |
0(0.00) |
|
F |
3(3.30) |
1(2.97) |
0(0.00) |
|
|
60+ |
M |
3(3.30) |
1(1.49) |
2(2.44) |
|
F |
0(0.00) |
1(4.46) |
1(1.22) |
|
|
TOTAL |
M |
33(36.59) |
8(8.79) |
5(6.10) |
|
F |
25(30.49) |
17(18.68) |
3(3.66) |
|
|
Total |
58(67.07) |
25(30.49) |
8(9.76) |
|
The distribution of the studied populations by age and sex is presented in Table 9 and the prevalence of high blood pressure was highest in the age group 60 and more in females of Bhumij and Bathudi community but in case of Savar the males are more affected than the females.
Table 10 MAP (Mean Arterial Pressure) status of the three tribes
|
BHUMIJ |
||||
|
SEX |
MAP Normal(<100) N (%) |
MAP =100-<107 N (%) |
MAP N (%) |
TOTAL N (%) |
|
M |
39(32.77) |
12(10.08) |
14(11.76) |
65(54.62) |
|
F |
28(23.53) |
15(12.61) |
11(9.24) |
54(45.38) |
|
TOTAL |
67(56.30) |
27(22.69) |
25(21.01) |
119(100) |
|
BATHUDI |
||||
|
SEX |
MAP Normal(<100) N (%) |
MAP =100-<107 N (%) |
MAP =>107 N (%) |
TOTAL N (%) |
|
M |
55(40.74) |
12(8.89) |
6(6.58) |
73(54.07) |
|
F |
29(21.48) |
18(13.33) |
15(9.88) |
62(45.93) |
|
TOTAL |
84(62.22) |
30(22.22) |
21(16.46) |
135(100) |
|
SAVAR |
||||
|
SEX |
MAP Normal(<100) N (%) |
MAP N (%) |
MAP N (%) |
TOTAL N (%) |
|
M |
30(36.59) |
8(9.76) |
6(7.32) |
42(51.22) |
|
F |
33(40.24) |
4(4.88) |
15(18.29) |
40(48.78) |
|
TOTAL |
63(76.83) |
12(43.92) |
21(25.61) |
82(100) |
Table 10 shows that in Bhumij community the normal mean arterial pressure 56.30 percent, where as it is 32.77 percent in case of males and 23.53 percent in case, in Bathudi community the normal mean arterial pressure 62.22 percent, where as it is 21.48 percent in case of males and 40.74 percent in case and in Savar community the normal mean arterial pressure 76.83 percent, where as it is 36.59 percent in case of males and 40.24 percent in case.
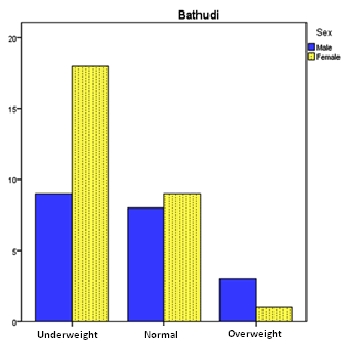
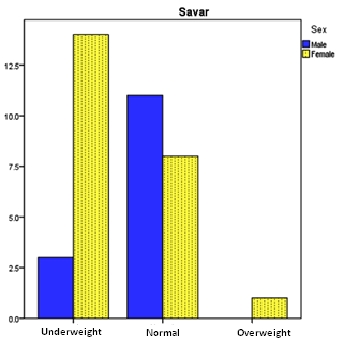
Table 11 presents the classification of nutritional status for the three tribes according to sex. From the total sample 38.24% of Bhumij population comes under the underweight category, 58.82% under the normal category and only 2.94% comes under the overweight category; 56.25% of Bathudi population comes under the underweight category, 35.41% comes under the normal category and 8.33% comes under the overweight category; 45.95% of the Savar population comes under the underweight category, 51.35% comes under the normal category and 2.70% comes under the overweight category. Males show higher BMI values than females.
Table 11. Nutritional status of the three tribes
|
SEX |
Underweight |
Normal |
Overweight |
|||
|
N |
% |
N |
% |
N |
% |
|
|
Bhumij |
||||||
|
Male |
10 |
29.41 |
24 |
70.58 |
0 |
0 |
|
Female |
16 |
47.06 |
16 |
47.08 |
2 |
5.88 |
|
Total |
26 |
38.24 |
40 |
58.82 |
2 |
2.94 |
|
Bathudi |
||||||
|
Male |
9 |
45 |
8 |
40 |
3 |
15 |
|
Female |
18 |
64.29 |
9 |
32.14 |
1 |
3.57 |
|
Total |
27 |
56.25 |
17 |
35.41 |
4 |
8.33 |
|
Savar |
||||||
|
Male |
3 |
21.43 |
11 |
78.57 |
0 |
0 |
|
Female |
14 |
60.87 |
8 |
34.78 |
1 |
4.35 |
|
Total |
17 |
45.95 |
19 |
51.35 |
1 |
2.70 |
Table 12 Salt Intake per Person per Day (in gms)
|
TRIBE |
SEX |
N |
Mean |
Std. Deviation |
|
BHUMIJ |
M |
20 |
18.75 |
6.025 |
|
F |
32 |
18.25 |
5.304 |
|
|
Total |
52 |
18.44 |
5.539 |
|
|
BATHUDI |
M |
18 |
16.44 |
2.572 |
|
F |
16 |
16.50 |
4.967 |
|
|
Total |
34 |
16.47 |
3.824 |
|
|
SAVAR |
M |
9 |
14.22 |
1.716 |
|
F |
7 |
13.43 |
1.718 |
|
|
Total |
16 |
13.88 |
1.708 |
Table 12 shows that mean salt intake of Bhumij community is 18.75 gms in males and 18.25 gms in females, in Bathudi community is 16.44 in males and 16.50 in females, in Savar is 14.22 in males and 13.43 in females.
Discussion
In recent times, a group of biological anthropologists favor political – economic analysis of human biological variation and health in addition to already favored human ecological approach to the study of health.
Age-Sex Structure: Demographic parameter of Bhumij and Bathudi suggests that the population pyramid shows a reduction in old age population with a better sex ratio i.e. 1058 and 1075 respectively.
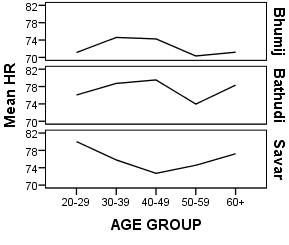
Blood pressure: Variation in blood pressure has been the subject of extensive research because it is a common risk factor for cardiovascular and renal disease. Blood pressures and rates of hypertension have been shown to increase in traditional populations undergoing modernization. Variation in blood pressure has been the subject of extensive research because it is a common risk factor for cardiovascular and renal disease. It may be observed that while in Bhumij and Bathudi tribes, their male members beyond the age of 60 show maximum mean systolic blood pressure, in Savar tribe it is found in the male members belonging to the age group 40-49. But while 152.27 are recorded as maximum mean systolic blood pressure in Bhumij population, it is 143.2 in Bathudi population and 120.63 in Savar population. On the contrary in female populations of these tribes, the maximum mean systolic blood pressure is observed in their 60+ age group and while 148.79 is recorded as maximum mean systolic blood pressure in Bhumij females, it is 150.00 in Bathudi females and 155.00 in Savar females. Thus in Bathudi and Savar communities the females have greater mean systolic pressure while in Bhumij the males are having greater systolic pressure (Table V and Fig 2) The maximum mean diastolic blood pressure is observed in 60+ male population of Bhumij community (86.82), in the population in of Bathudi community (87.56), which lies in the range of 40-49 years, in the population of Savar community (83.91) that lies in the age range of 30-39 years. In the female population of these tribals, however, the maximum mean diastolic blood pressure is observed to be 86.25 both in the population of Bhumij and Savar communities that lies in the age range of 50-59 years, whereas it is 84.50 in the 60+ population of Bathudi community. (Table 6, Fig.2). The males mean diastolic blood pressure of Bhumij increases from the age group 40 onwards. In Bathudi males mean diastolic pressure is high at 30-39 age group and 50-59 age group i.e. in the working and adult population and in Savar the males of 30-39 age group has the maximum diastolic blood pressure; this shows that in Savar the blood pressure is getting higher in the younger generation. In both the tribes the females are having higher diastolic pressure than the males, but in the Savar community both the males and females have the same mean diastolic pressure (Table 6 and Fig 2).
Fig 2 Comparision of mean systolic blood pressure and mean diastolic blood pressure among Bhumij, Bathudi and Savar community
|
|
|
|
Mean systolic blood pressure |
Mean diastolic blood pressure |
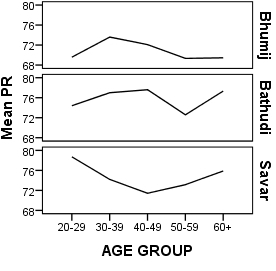
In Bhumij and Bathudi community the working population i.e. the population belonging to the age group 30-49 years the higher heart rate is observed than those belonging to the other age groups, and in the age group 50-59 there is a sudden decrease. But in case of Savar community there is a steady decrease of heart rate from the age group 30-49 and then it increases from age of 50 onwards. The Bathudi and Savar females are having greater heart rate than the males and it’s just the reverse in case of Bhumij. Both in the Bathudi and Savar communities females exhibit greater heart rate than those of Bhumij tribe, while Savar has higher heart rate than the Bathudi(Table 7 and Fig 3). The pulse rate is observed the same as in case of the mean heart rate (Table 8 and fig 3).
Fig 3 Comparision of mean Heart rate and mean Pulse rate among Bhumij, Bathudi and Savar community
|
|
|
|
Heart rate |
Pulse rate |
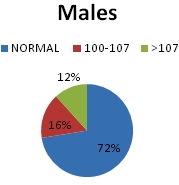
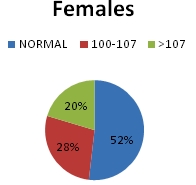
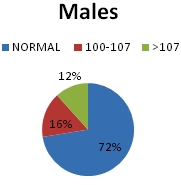
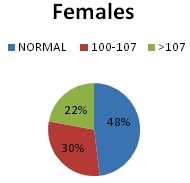
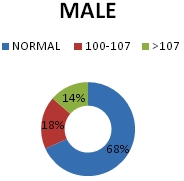
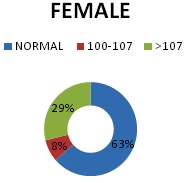
The mean arterial pressure of males of Bathudi community is higher than Bhumij and Savar communities. But in females the mean arterial pressure of Bhumij community is greater than Bathudi community, and of Savar community is greater than both Bhumij and Bathudi communities. From overall the MAP of Bhumij is quite higher than the Bathudi tribe. The normal map status in Bhumij and Bathudi community is that the percentage of males is higher than the normal females but in Savar tribe, percentage of males is higher than females (Table 10 and fig 4).
Fig 4 MAP status of the three tribes
|
|
|
|
MAP status of Bhumij community |
|
|
|
|
|
MAP status of Bathudi community |
|
|
|
|
|
MAP status of Savar community |
|
Table 13 Prevalence of hypertension in Indian populations
|
Population / Place of study |
Prevalence (%) |
Reference |
|
|
Men |
Women |
||
|
Tribal |
|||
|
Lepchas (Sikkim)* |
45.3 |
34.0 |
Mukhopadhyay et al.(1996) |
|
Yerukala (Andhra Pradesh)* |
2.8 |
1.2 |
Reddy (1998) |
|
Khondh (Andhra Pradesh)* |
7.8 |
11.5 |
Kusuma et al.(2004) |
|
Valmiki (Andhra Pradesh)* |
13.5 |
32.4 |
Kusuma et al.(2004) |
|
Rural |
|||
|
Rajasthan |
6.9 |
8.8 |
Baldwa et al. (1984) |
|
Himalayas (high altitude) |
2.4 |
2.4 |
Puri et al.(1986) |
|
Rajasthan |
6.1 |
7.3 |
Hussain et al. (1988) |
|
Western Rajasthan |
4.0 |
3.6 |
Kumar and Chaudhary (1991) |
|
Maharashtra |
2.9 |
4.1 |
Jajoo et al. (1993) |
|
Kerala |
17.9 |
- |
Kutty et al. (1993) |
|
Uttar Pradesh |
1.6 |
- |
Agarwal et al. (1994) |
|
Rajasthan* |
23.7 |
16.9 |
Gupta and Sharma (1994) |
|
Around Delhi |
4.1 |
3.3 |
Chadha et al. (1997) |
|
West Bengal |
1.4 |
(both sexes) |
Majumdar et al. (1994) |
|
Andhra Pradesh (lower castes)* |
4.5 |
8.3 |
Reddy (1998) |
|
Andhra Pradesh (Middle castes)* |
13.7 |
6.2 |
Reddy (1998) |
|
Population around Delhi** |
4.1 |
3.3 |
Chadha et al. (1997) |
|
Wadabalija (Andhra Pradesh)* |
22.6 |
19.8 |
Kusuma et al. (2004) |
|
Settibalija (Andhra Pradesh)* |
27.9 |
21.4 |
Kusuma et al. (2004) |
|
Tibetans (Odisha) |
35.2 |
32.8 |
Satapathy KC(2010) |
|
Urban |
|||
|
Haryana |
6.0 |
7.1 |
Gupta et al. (1978) |
|
Delhi |
11.7 |
13.7 |
Chadha et al. (1997) |
|
Delhi** |
25.9 |
22.2 |
Gopinath et al. (1994) |
|
Rajasthan* |
29.5 |
33.5 |
Gupta et al. (1995) |
|
Delhi** |
10.8 |
12.3 |
Chadha et al. (1997) |
|
Andhra Pradesh* |
18.9 |
12.3 |
Reddy (1998) |
|
Wadabalija (Andhra Pradesh)* |
18.4 |
18.4 |
Kusuma et al.(2004) |
|
Settibalija (Andhra Pradesh)* |
27.1 |
26.1 |
Kusuma et al. (2004) |
|
Bhubaneswar (Odisha) |
37.1 |
23.9 |
Banerji, M et al (2003) |
*SBP 140 and/or DBP 90 mmHg; **SBP 160 and/or DBP 90 mmHg
Previous studies from India (Table 13) have reported variable hypertension prevalence, and most have used WHO criteria (i.e., 160mmHg and/or 95mmHg). The present study results are thus not directly comparable to the other studies from India since the present study uses JNC-VII criteria for classifying hypertension. It is observed that the percentage of the population with Normal blood pressure in Bathudi and Savar communities is more than that of Bhumij community. In both the tribes more males are normal than females. The Savar people are more affected with hypotension than the Bhumij and Bathudi people, and hypotension is more among males than females. The hypertension is higher in old population of females of Bhumij and Bathudi communities. But in case of Savar it’s just the opposite; the males are having higher blood pressure in comparison to that of the females. But the males of the three communities exhibit a varied blood pressure profile that is while more number of males in the age group 40-49 suffer hypertension in Bhumij and Savar communities, age group has in Bathudi community more number of males in the age group 50-59 suffer hypertension. In Bhumij community the percentage of population affected by hypertension is 21.01%, in Bathudi community it is 12.59% and in Savar community is 9.76% (Table 9).
Table 14 correlation coefficient of systolic blood pressure and diastolic blood pressure with age-group.
|
CC & Age |
|
|
SBP |
0.576** |
|
DBP |
0.369** |
**. Correlation is significant at the 0.01 level
*. Correlation is significant at the 0.05 level
From table number 14 it is observed that systolic blood pressure has a strong positive correlation with age group. Diastolic blood pressure has a strong positive correlation with age.
BMI(Body mass index) distribution for the tribal population shows a very small percentage of people under the overweight category i.e. 2.94 percentage in Bhumij, 8.33 percentage in Bathudi and 2.70 percentage in Bathudi. Much people come under the underweight and normal category (Table 11 and fig 5).
Fig 5 BMI distribution among the three tribes
|
|
|
|
|
|
Salt intake
It is clearly seen that the salt intake of the Bhumij population is quite high than that of Bathudi and Savar populations; which may be the reason behind the high blood pressure seen in the Bhumij population, though all the three tribes live in the same ecological habitat (Table 12).
Conclusion
All the tribes are in transition in terms of blood pressure. Earlier as reported, hypertension was not so common among the tribes of India. But in the present study significant number of hypertensive cases has been observed in all the communities. However, the Bhumij population shows a higher percentage of hypertensive cases than the Bathudi and Savar communities. There are cases of hypotension but the percentage of population with normal blood pressure is also comparatively higher. The general reasons for high blood pressure among the Bhumij may be due to their nutrition such as high salt intake, traditional alcoholic drinks as well as poverty, working pattern, food culture and geographic location . Adoption of westernized life styles and exposure to stress of acculturation and modernization might be the reason for an increased blood pressure. But as their socio-economic conditions are changing, the entry of modernized life style will make them more prone to high blood pressure in future. Risk factors of hypertension identified in this study were suggestive and not a causal one as the study was cross sectional. This hypothesis could be explored by future analytical or randomized trials.
Reference
- Agrawal, A.L., Yunus, M., Khan, A. and Ahmed, J. (1994).A clinical-epidemiological study of hypertension in rural population of Jawan block, Aligarh (UP. India. J. Roy. Soc. Health, 114:17-19.
- Baldwa, V.S., Gupta, B.S., Bhargava, V., Sanghvi, S, Purohit, S. (1984). Prevalence of Hypertension in a rural community of Rajasthan. J. Assoc. Physicians Ind., 32, 1042-1047
- Banerji, M, Kusuma, Y.S and Das, P.K. (2003). Prevalence of Hypertension Among an Urban Population of Bhubaneswar City Orissa, India. J. Hum. Ecol., 14(5),377-381
- Chadha, S.L., Gopinath, N.and Shekhawat, S. (1997).Urban-rural differences in the Prevalence of coronary heart disease and its risk factors in Delhi. Bull. WHO, 75: 31-38.
- Gopinath, N., Chadha, S.L., Shekawat, S. and Tandon, R.(1994). A 3-year follow-up of hypertension in Delhi. Bull. WHO, 72 :715-720.
- Gupta, R., Gupta, S., Gupta, V.P. and Prakash, H.(1995).Prevalence and determinants of hypertension in the urban population of Jaipur in western India. J. Hypertens., 13:1193-1200.
- Gupta, S.P., Siwach, S.B. and Moda, V.K.(1978). Epidemiology of hypertension based on total community in an urban population (Rothak). Ind. Heart J., 30, 315.
- Gupta, R., Sharma, A.K.( 1994) Prevalence of hypertension and subtypes in an Indian rural population: clinical and electrocardiographic correlates. J Hum Hypertens.,8,823–9.
- Hathur, B., Basavegowda, M. and N.C. Ashok. (2013). Hypertension: An emerging threat among tribal population of Mysore; Jenu Kuruba tribe diabetes and hypertension study. International Journal of Health and Allied Science, 2(4), 270-274.
- Hussain, S.A., Nayak, K.C., Gupta A.( 1988). A study of prevalence of hypertension with special reference to economic, educational, environmental and hereditary factors in general population of north-west Rajasthan. Indian Heart J; 40,148-151
- JNC7 Express. The Seventh Report of the Joint National Committee on Prevention, Detection, Evaluation and Treatment of High Blood Pressure. US Department of Health and Human Services. National Institutes of Health National Heart, Lung, and Blood Institute. NIH Publication No.03-5233. May 2003:2-3.
- Jajoo, U.N., Kalantri, S.P., Gupta, O.P., Jain, A.P..(1993). The prevalence of hypertension in rural population around Sewagram, J Assoc Physicians Ind; 41,422-424.
- Kusuma, Y.S., Babu, B.V., Naidu, J.M. (2004). Prevalence of hypertension in some cross-cultural populations of Visakhapatnam district, South India. Ethn Dis., 14,250–9.
- Kutty, V.R., Balakrishnan, K.G., Jayasree, A.K., Thoman, A. (1993). Prevalence of coronary heart disease in the rural population of Thiruvananthapuram district, Kerala, India. Int J Cardiol., 39,59-70.
- Majumder, P.P., Nayak, S., Bhattacharya, S.K., Ghosh, K.K., Pal, S. and Mukherjee, B.N.(1994). An epidemiological study of blood pressure and lipid levels among Marwaris of Calcutta, India. Am. J. Hum. Biol., 6, 183-194.
- Manimunda SP, A P Suganan, V Benegal, N Balakrishna, M V Rao and KS Pelsa.(2011). Association of hypertension with risk factors and hypertension related behavour among the aboriginal Nicoborese tribes living in Car Nicober Island, India. Ind. J. Med. Res. 133(3):287-293.
- Mukhopadhya, B., Mukhopadhya, S., and Mazumder, P. P. (1996). Blood pressure profile of Lephas of the Sikkim Himayalaya, Human Biology, 68, 131-145.
- Kumar, P. and Chaudhary, V.(1991). Epidemiological study of hypertension in western Rajasthan, Ind. Heart J., 43, 43-45.
- Puri, D.S., Pal, L.S., Gupta, B.P., Swami, H.M., Dasgupta, D.J. (1986) Distribution of blood pressure and hypertension in healthy subjects residing at high altitude in the Himalayas. J Assoc Physicians India,34, 477–9.
- Reddy, B.N.(1998). Blood pressure and adiposity: a comparative study of socioeconomically diverse groups of Andhra Pradesh, India, Am J Hum Biol,10,5–21.
- Sachdev, B. (2011). Prevalence of Hypertension and associated risk factors among Nomad Tribe groups. Antrocom Online Journal of Anthropology, 7(2): 1973-2880.
- Satapathy, K.C. (2010). Refugees’ Health : A Bio-anthropological Study on Emerging Health Problems of Tibetan Refugees of Chandragiri, Odisha. Bhubaneswar: Athena Books.
Address for communication : Dr. K. C. Satapathy, Reader, P. G. Department of Anthropology, Utkal University, Bhubaneswar-4, Odisha.
Authors details: 1,2 & 3 : Department of Anthropology, Utkal University, Bhubaneswar, Odisha and 4- Professor in Anthropology, Guru Ghashidas Central University, Bilashpur.


